A Waiting Game Part 1
10 Feb 2018
I got a fun homework from my Japanese lesson. The sensei wanted me to practice talking to people in Japanese, and to practice the use of active and passive verb forms. 人を待ちます means waiting for someone, and the verb’s possible form, 待てます, means can wait for someone 人を待たせます means making somebody wait for you.
So I went around and asked people how long they are willing to wait for someone, and alternatively how long they are willing to make someone wait for him/her.
- 人を待ちとき、何分ぐらいなら待てますか
a)先生、上司のとき b)家族 c)友達 d)恋人 - 人を待たせるとき、何分ぐらいなら待たせてもらえと思いますか
a)先生、上司のとき b)家族 c)友達 d)恋人
The first question asks ‘when you wait for someone, how many minutes can you wait?’ (before you give up and go home)
The second question asks ‘when you make someone waits for you, how many minutes do you think you can make them wait?’
And for each question, they need to consider when the person they are waiting for or making to wait is a:
a) superior (teacher, boss), or b) family member, c) or friend, or d) lover
Some people ask a lot of questions to make me elaborate the situation, like if one can contact the other party, or if the other party is in trouble. So I need to give a bit more background: you are waiting at a place that is not too comfortable, for example, at a train station. You have no way to contact the other party. And you know (somehow) that the other person is fine, just somehow delayed. In other words, consider the scenarios more towards: 1) the willingness to wait for someone without getting too angry, and 2) making someone wait without feeling too guilty about it.
Here is the raw data: JpHWWaittimeDataPublic.csv
In this exercise, I found several commands and techniques to be useful for my analysis
pandas.crosstab(index, columns, values=None, rownames=None,\
colnames=None, aggfunc=None, margins=False, \
margins_name='All', dropna=True, normalize=False)
In this exercise, I decided to show data categorized by nationality (Japanese versus non-Japanese) and gender. So it is helpful to be able to quickly compute a simple cross-tabulation of these two factors, and check that I obtained data from more or less equal number of people from each group.
import pandas as pd

df = pd.read_csv('JpHWWaittimeDataPublic.csv')
tab = pd.crosstab(df['Gender'], df['isJapanese'])
print(tab)| isJapanese | False | True | ||
| Gender | ||||
| Female | 10 | 8 | ||
| Male | 8 | 8 |
DataFrame.groupby(by=None, axis=0, level=None, as_index=True, \
sort=True, group_keys=True, squeeze=False, **kwargs)
It is extremely useful for sorting data. And when combined with .agg(), one can easily see the descriptive statistics of the sorted data. On top of that, it can further be combined with .plot() for quick visualization of the sorted data.
3) matching text: checking if a particular string matches a given expression Before, I tried to use re.match() but ran into issues. Then I found a simpler way that works in this particular example. I was trying to see if each subject is Japanese or belongs to other nationalities. And I placed the following in a for loop to check for each subject:
result = bool('Japan' in line)This line returns True if under the Nationality column, Japan is entered, and False if any other nationality is entered.
4) Use of a for loop to add another column to a dataframe
5) Use of Matplotlib boxplot and bar graphs to visualize data
First of all, let’s see on average how long are people willing to wait, and how long they think it’s ok to make other people wait:
import matplotlib.pyplot as plt
import seaborn

plt.figure(figsize=(15,5))
sns.boxplot(data =df)
plt.show()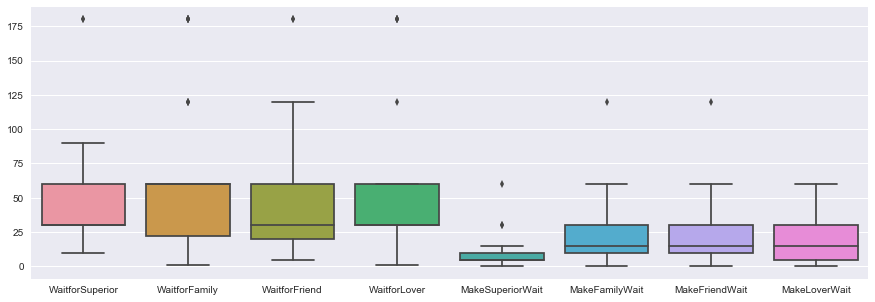
Next lets look if being Japanese or not affects waiting times:
import pandas as pd
import matplotlib.pyplot as plt
import numpy as np

df = pd.read_csv('JpHWWaittimeDataPublic.csv')

# Create empty list,
# then using a for loop to generate a list of boolean values
#  showing whether each test subject is Japanese or not,
# finally adding that list to the dataframe as a new column:
local = []
for index, item in df.iterrows():
    line = item['Nationality']
    result = bool('Japan' in line)
    local.append(result)
df['isJapanese'] = list(local)

fig, ax = plt.subplots(figsize=(10,10))
df.groupby('isJapanese').agg([np.mean]).plot(kind='bar', \
ax=ax, color = ['coral','orange','yellowgreen','skyblue','orangered',\
'darkorange','green','steelblue'])
# for a list of color names:
# https://matplotlib.org/examples/color/named_colors.html

plt.legend(['Wait for superior','Wait for family member',\
'Wait for friend','Wait for lover',\
'Make superior wait','Make family member wait',\
'Make friend wait','Make lover wait'],\
bbox_to_anchor=(1.05, 1), loc=2, borderaxespad=0.)
# I am aiming to put the legend outside the graph,
#  and it takes some trial and error to get the position right.

plt.ylabel('Length of time in minutes', fontsize =14)
plt.xlabel('Nationality', fontsize=14)
labels = ['Non-Japanese', 'Japanese']
ax.set_xticklabels(labels, fontsize=14, rotation =0)
plt.show()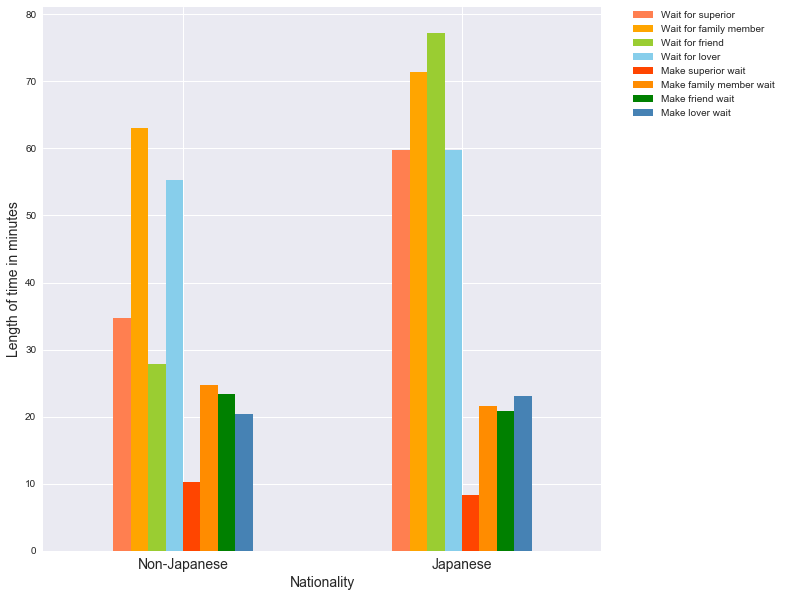
There is an alternative way to see the data sorted by nationality, by calling the ‘boxplot’ method to the dataframe:
import matplotlib.pyplot as plt
import numpy as np
import matplotlib.pyplot as plt

df.boxplot(by='isJapanese', layout=(2,4), figsize=(10,5))
# use the 'layout' argument to control how many plots to show
#  on how many lines

plt.show()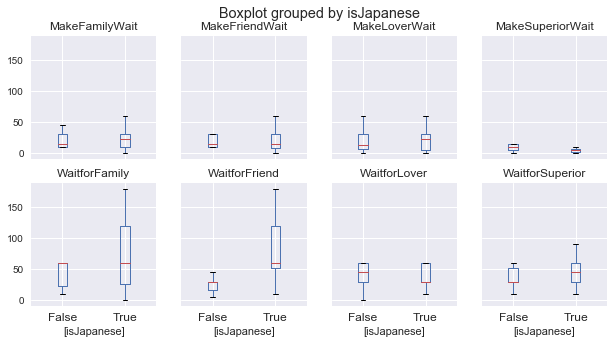
We can see that in general, Japanese are willing to wait longer for others compared to non-Japanese, regardless of who the other party is. Non-Japanese people are more willing to wait for family members and lovers than for superiors and friends. Regardless of nationality, people are in general wary of making their superiors wait for them.
Thirdly, let’s see how gender affect waiting times:
import matplotlib.pyplot as plt
import pandas as pd

df = pd.read_csv('JpHWWaittimeDataPublic.csv')

fig, ax = plt.subplots(figsize=(10,10))
df.groupby('Gender').agg([np.mean]).plot(kind='bar', ax=ax,color = ['coral','orange','yellowgreen','skyblue','orangered',\
'darkorange','green','steelblue'])
plt.legend(['Wait for superior','Wait for family member',\
'Wait for friend','Wait for lover','Make superior wait',\
'Make family member wait',\
'Make friend wait','Make lover wait'],\
bbox_to_anchor=(1.05, 1), loc=2, borderaxespad=0.)
plt.ylabel('Length of time in minutes', fontsize =14)
plt.xlabel('Gender', fontsize=14)
ax.set_xticklabels(labels=['Female', 'Male'], fontsize=14, rotation =0)
plt.show()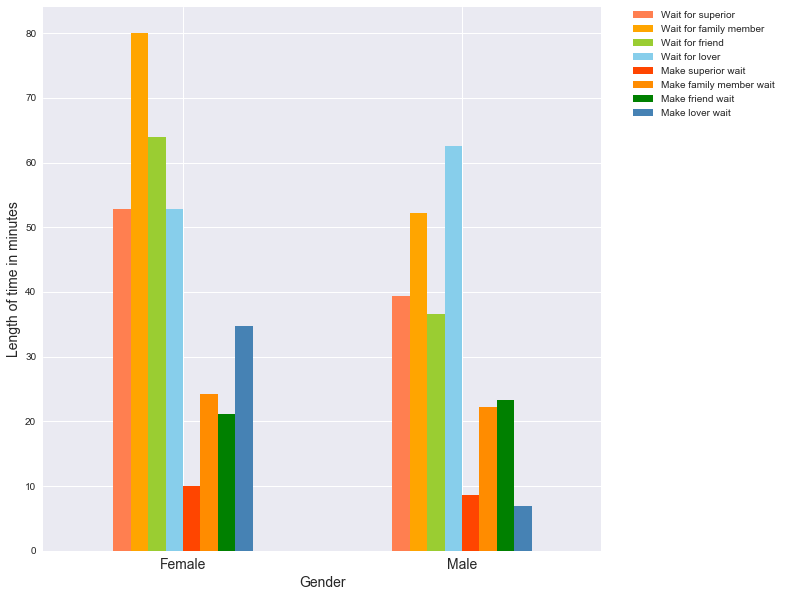
Here I just want to point out that, females are in general more patient in waiting for others compared to males, and the two genders responds more or less the same on the ‘superior’, ‘family’, and ‘friends’ categories. However, when it comes to the ‘lover’ category, females are more ok in making their lovers wait, while males are more careful in not making their lovers wait.
In part II of this exercise, I’ll go into ‘machine learning’ (or ‘statistically learning’), where knowing the times a particular test subject is willing to wait for others or make others wait, we can make an educated guess on whether that subject is male or female, and whether Japanese or non-Japanese.