Analyzing Social Media Data
28 Jan 2019
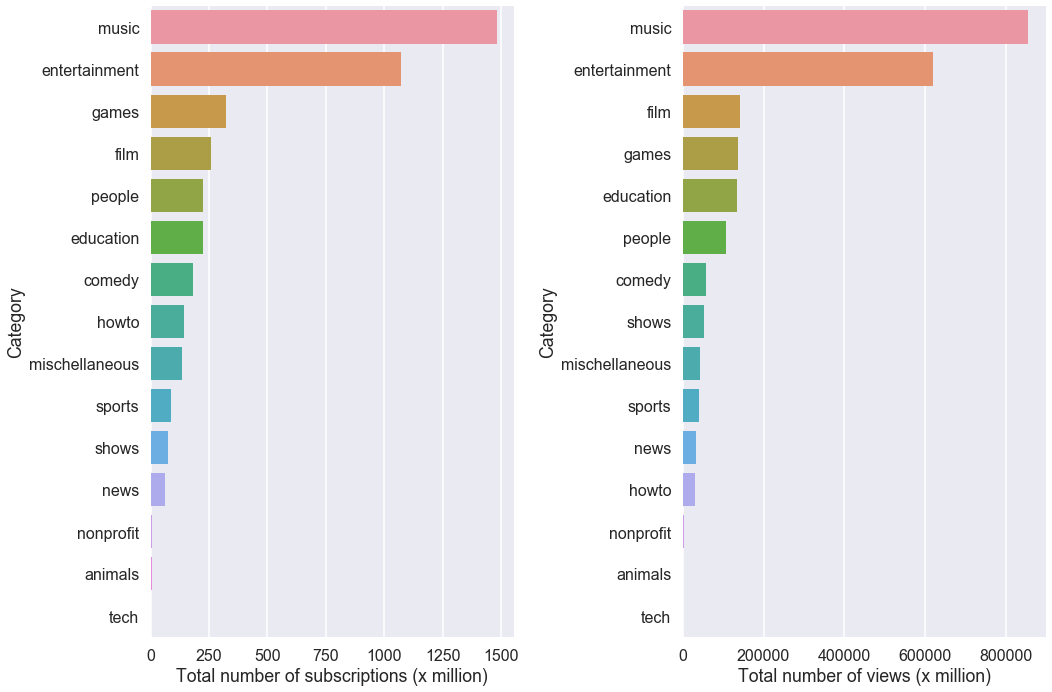
What do people watch on Youtube? I got curious as I learn how to analyze social media data. So I go to SocialBlade, look at the “Top 500 YouTube Influential YouTube Channels (sorted by SB rank)”, and apply the lxml parser to generate the above data. In other words, I need to extract data from a website by web scraping, followed by cleaning up and organizing the data into a format (dataframe) that I can use.
First, to get a table of the names of the top 500 YouTube channels, number of views and subscribers,
import lxml.html as lh

url = 'https://socialblade.com/youtube/top/500'
r = requests.get(url)
doc = lh.fromstring(r.content)

# Need to find \<div> elements with an attribute that contains the specific string that will lead to the data that I need: in this case, text of a certain size and background color
table_data = doc.xpath("//div[contains(@style, 'width: 860px; background: #f')]")
# Data will be collected as a list of HTML element.

# To convert the data into a readable list and name it 'col':

col = []

for t in table_data:
    name = t.text_content()
    col.append((name))
The first entry of the list looks something like:
13th
A+
Toys and Colors
199
8,352,442
4,637,771,013
</br> </br>
Next, I convert the list ‘col’ into a dataframe:
import pandas as pd

df = pd.DataFrame(col)
All information that I need is contained in 1 column of data: 0 0 \n1st\n\nA++ \n\n\nT-Series\n\n\n13,062\n\n82,…
The third step is to extract the information contained in that one long string of text, and put into separate columns in the dataframe. Need to ignore the unimportant parts, and split them up:
df1 = df[0].str.split('\n', expand=True)

# (Need to further clean up the dataframe, because the original table on the website is misaligned. Some entries have more columns than others. And there were columns that do not contain data, so they need to be cut out. I will skip those steps here.)

# Give proper names to each column:
df1.columns = ['Rank', 'Grade', 'Username', 'Uploads', 'Subs', 'Video Views']

# Convert str into numbers for the 'Uploads', 'Subs', and 'Video Views' columns
df1['Uploads'] = df1['Uploads'].str.replace(',', '')
df1['Subs'] = df1['Subs'].str.replace(',', '')
df1['Video Views'] = df1['Video Views'].str.replace(',', '')

df1['Uploads'] = pd.to_numeric(df1['Uploads'])
df1['Subs'] = pd.to_numeric(df1['Subs'])
df1['Video Views'] = pd.to_numeric(df1['Video Views'])
To find out which YouTube channel belongs to which category, I use a different method (etree.tostring) to extract that information than lh.fromstring used previously.
from lxml import etree

table_data_list = []

for j in table_data:
    data_for_list = etree.tostring(j)
    table_data_list.append(data_for_list)

# To extract categorical data for each entry and put it into a list:
table_data_list_category = []

for k in table_data_list:
    data_for_category = k.decode("utf-8")
    data_for_category = data_for_category.split('Category: ', 1)[1].split('"', 1)[0]
    table_data_list_category.append(data_for_category)

# Add the catagorical data to the dataframe generated above:
df1['Category'] = table_data_list_category
Importantly, the next step is to find out the sum of the number of subscription and views for each category, after grouping YouTube channels of the same category together:
Num_Subs_by_Category = df1.Subs.groupby(df1['Category']).sum().sort_values(ascending= False)/1000000

Num_Views_by_Category = df1['Video Views'].groupby(df1['Category']).sum().sort_values(ascending= False)/1000000

# Note: the counts are in millions
We are almost there! Finally I plot the data in a barchart:
import seaborn as sns
import matplotlib.pyplot as plt

f, axes = plt.subplots(1, 2, figsize=(15,10))
sns.set_context("poster")
g1 = sns.barplot(x= 'Subs', y = 'Category', data = Num_Subs_by_Category_df, ax=axes[0])
g1.set(xlabel='Total number of subscriptions (x million)')
g2 = sns.barplot(x= 'Video Views', y = 'Category', data = Num_Views_by_Category_df, ax=axes[1])
g2.set(xlabel='Total number of views (x million)')
plt.tight_layout()
plt.show()
Looks like music and entertainment have the most subscribers and views. Next to these, people watch games and look up information about file(movies) on YouTube. Education (including shows designed for toddlers, young children)- related channels are pretty high up as well. Contrary to popular believe about people are watching cute cats all day long on YouTube, the ‘animal’ class falls outside of the top 10 most popular categories.